Case Study: Chemical Program Optimization for a Major Canadian Producer
A large Canadian producer with multiple chemical vendors, hundreds of injection points and vendor-authored reporting. Prodesy exposed $660,000 a month in cost variance and cut PPM variance from over 300 to 29.
The situation
The producer managed a multi-vendor production chemical program across several fields. Each vendor reported monthly on deliveries and invoiced accordingly. Targets existed, but actual PPM was calculated by the vendor on the vendor’s own production estimates. The chemical team consolidated seven spreadsheets a month and had no independent view of treatment accuracy.
What Prodesy changed
- Every injection point, target and vendor loaded into one model.
- Production data imported from accounting and allocated to each treatment point.
- Vendors submitted pump rates and tank levels through Prodesy Mobile; telemetered sites fed automatically.
- Actual PPM recalculated on real production, daily.
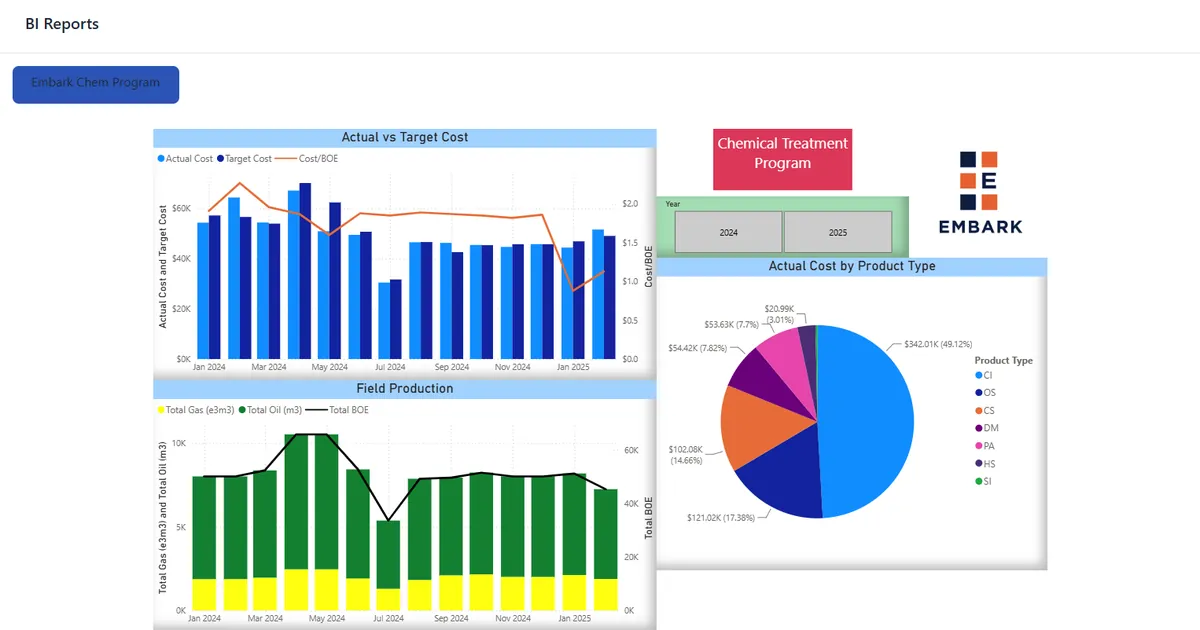
- Compliance and cost per BOE by vendor on a Power BI dashboard.
Results
The variance had two sources: injection points running well above target on vendor-estimated production, and a smaller set running below target that had produced integrity issues. With actual PPM visible per point, the producer corrected both and moved vendor reviews from delivery volume to treatment accuracy. See vendor benchmarking for the framework.
Program details
| Item | Detail |
|---|---|
| Operator | Major Canadian oil & gas producer, multiple fields, Western Canadian Sedimentary Basin |
| Programs | Corrosion inhibitor, scale inhibitor, paraffin inhibitor, demulsifier, H2S scavenger, biocide |
| Vendors | Seven, each with its own reporting format |
| Data sources | Production accounting exports, vendor field reads via Prodesy Mobile, tank telemetry on instrumented pads, third-party lab results |
| Timeline | Injection points and targets loaded in week one; production integration and vendor onboarding in weeks two and three; first consolidated compliance review in week five |
| Owner | Corporate chemical manager, with production engineers by area |
What the producer would tell a peer
Three things. First, the variance was not where anyone expected: the largest over-treatment was on the best-run vendor’s wells, because those targets had not moved while production declined. Second, the vendors accepted the scorecard faster than the internal team expected, because it gave the good ones a way to prove it. Third, the spreadsheet consolidation the chemical team had done every month for years simply stopped. Read how Prodesy works for producers or see pricing.
See your chemical program in Prodesy
A 30-minute online demo using your injection points, vendors and lab data. You leave knowing where variance and cost are hiding.
Book a demo