Case Studies: Documented Results from Real Chemical Programs
Three deployments, three different problems: a producer’s cost variance, a vendor’s lab bottleneck and a vendor’s contract model. Each with the numbers.
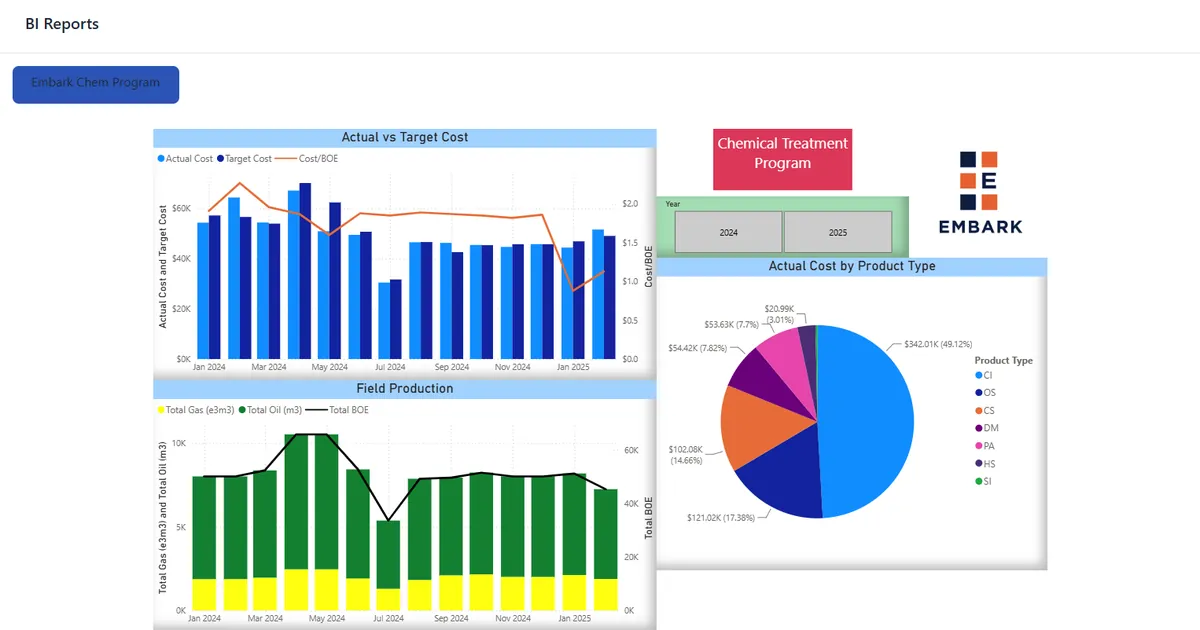
$660K/month chemical cost variance eliminated
Major Canadian producer. PPM variance cut from over 300 to 29 after production data was integrated and vendors were benchmarked on treatment accuracy.
Pine Island doubles lab productivity
Pine Island Chemical Solutions, chemical vendor. 200% lab reporting productivity, less field admin and real-time client dashboards after replacing spreadsheets with Prodesy.
90%+ cut in net treatment variance
Western Canadian chemical vendor. Telemetry-driven Prodesy let the vendor compete on verified performance and move to performance-based contracts.
Producers: see how Prodesy works for producers. Vendors: see how it works for chemical vendors.
What the case studies have in common
None of the three replaced hardware, changed chemical vendors or added staff. Each one integrated data that already existed, calculated treatment accuracy on real production and put the result in front of both the producer and the vendor. The savings and productivity gains followed from visibility. That is the Prodesy model: measure the program, then optimize it. Read what treatment variance is, or see pricing.
See your chemical program in Prodesy
A 30-minute online demo using your injection points, vendors and lab data. You leave knowing where variance and cost are hiding.
Book a demo