For Producers: Cut Chemical Spend Without Sacrificing Asset Protection
Chemical managers, production engineers and production managers use Prodesy to see actual vs target treatment per injection point, benchmark vendors on results instead of price, and stop paying for chemical the well never needed.
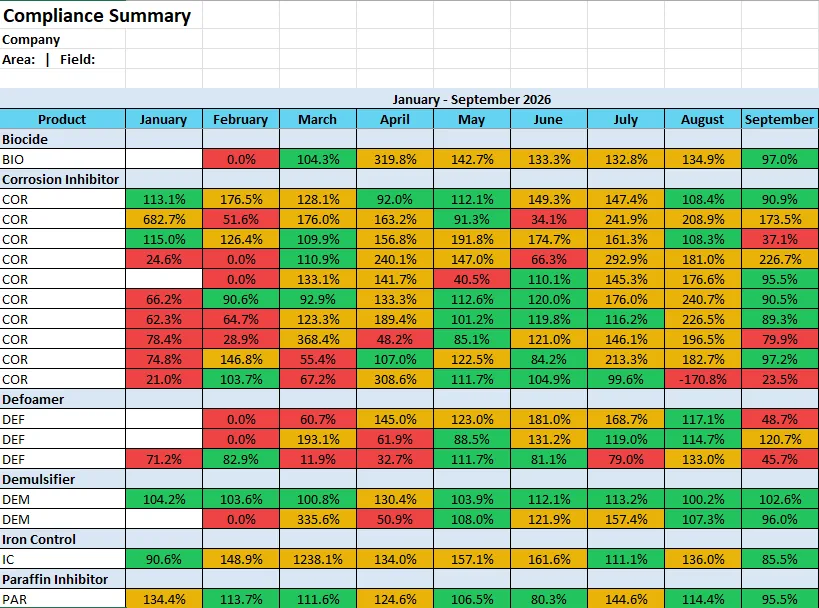
Why pay for this when vendors report for free?
Because the vendor’s report is written by the party being measured. It shows what was delivered and invoiced; it does not show target-versus-actual PPM per well against your production, or how one vendor’s accuracy compares to another’s. Prodesy is the independent record. A major Canadian producer using it found $660,000 a month in chemical cost variance that had been invisible in vendor reporting, and cut PPM variance from over 300 to 29.
What producers get
Treatment accuracy
Compliance percentage per injection point, per product, per vendor, updated daily. Over-treatment is money; under-treatment is integrity risk. Both are flagged.
Vendor benchmarking
PPM accuracy, cost per BOE, KPI outcomes and service adherence by vendor. Contract renewals on evidence.
Cost per BOE
Chemical spend allocated to production, by well, product and program, in Power BI.
Integrity programs
Corrosion, bacteria and scale results attached to the treatment that should have prevented them.
Existing hardware
Your tank monitors and pumps, any vendor. No fleet replacement required.
Executive reporting
Program cost, variance and integrity KPIs on one dashboard for the monthly review.
How the ROI works
Three levers, in the order they show up. First, over-treatment: every injection point running above target is chemical bought for nothing, and on a large program that alone can exceed the subscription in month one. Second, under-treatment: the paraffin dewax event, corrosion failure or bacteria excursion that a 78% compliance flag would have prevented. Third, admin: the chemical team stops consolidating vendor spreadsheets and starts managing the program. Programs on Prodesy typically move from 15–20% variance to under 5% within two quarters. Use the PPM calculator to see what one point of variance costs on your volumes.
Adoption without a change-management project
Your vendors keep their workflow and submit field data through Prodesy Mobile, or their telemetry feeds it automatically. Your team gets the consolidated view without chasing anyone. Onboarding is 30 days: injection points and targets loaded in week one, vendor and telemetry connections in weeks two and three, live dashboards on your data by week four.
Questions producers ask before buying
Our chemical vendors already provide reporting for free. Why pay for Prodesy?
Vendor reporting is produced by the party being measured. Prodesy pulls injection rates, production data, lab results and telemetry into one independent record, so target-versus-actual PPM is visible per well, per vendor. One Canadian producer found $660,000 a month in cost variance that vendor reports had not surfaced.
How does Prodesy save money, and how fast?
Savings come from three places: over-treatment (chemical bought that the well did not need), under-treatment (integrity failures and dewax events) and admin time. Variance typically falls from 15–20% to under 5% within the first two quarters; the cost side shows in the first monthly reconciliation.
What does it cost?
A monthly subscription based on the number of chemical injection points, with data integration and dashboards included. See producer pricing.
Our staff and vendors are already too busy to adopt another system.
Field entry is a two-minute mobile form or arrives automatically from telemetry. Vendors keep their workflow and submit through Prodesy Mobile; producers get the data without chasing it.
What if it doesn't work for us?
Full refund at any point in the first three months. After that, cancel on 30 days’ notice.
See your chemical program in Prodesy
A 30-minute online demo using your injection points, vendors and lab data. You leave knowing where variance and cost are hiding.
Book a demo