Dashboards, Client Portal and Power BI Integration
Chemical program dashboards that answer the monthly review before it starts: cost vs target, compliance by product, cost per BOE, integrity KPIs, and a client portal that vendors put in front of their customers.
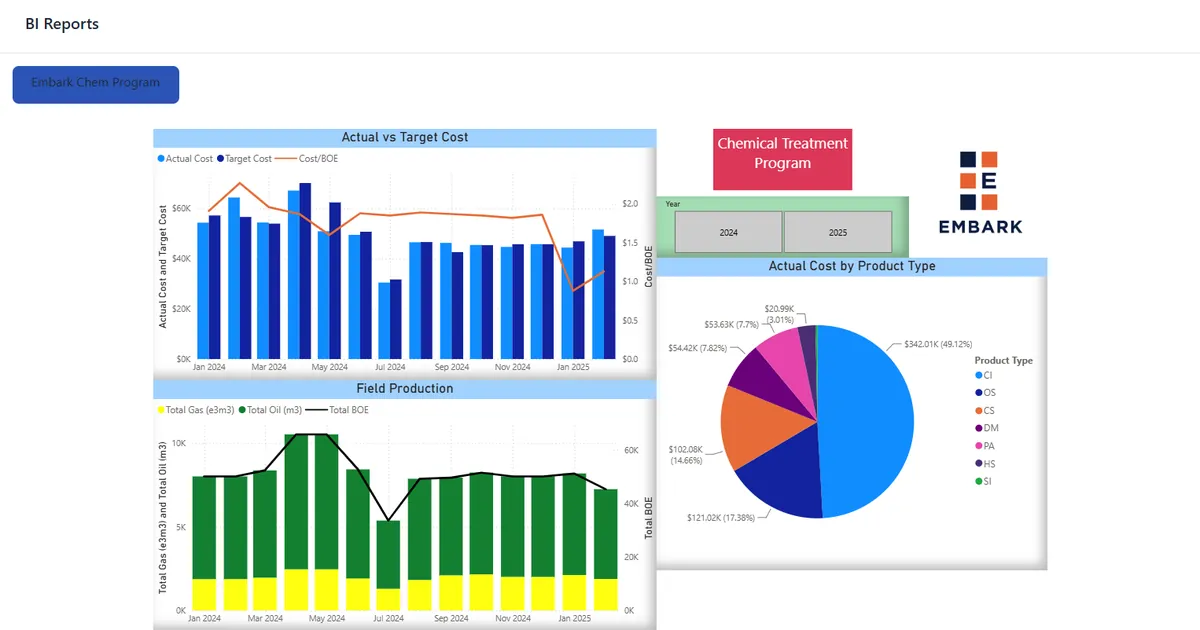
Standard dashboards
- Actual vs target cost, monthly, with cost per BOE
- Compliance by product type and by vendor
- Field production against chemical spend
- Spend by product type
- Inventory status and forecast run-out
- Lab KPIs by program: ATP, residuals, corrosion rate, H2S
- Scheduled vs completed events
Client portal for vendors
Chemical vendors give each customer a login to a white-label portal showing only that customer’s sites. Reports match what the customer already receives, then improve. It is the difference between emailing a PDF and being the platform the customer opens. See Prodesy for chemical vendors.
Your BI, your warehouse
Embedded Power BI is standard. Producers with a corporate BI stack pull the same model into Spotfire, Looker Studio or a data warehouse through the API, so chemical program KPIs sit next to production and cost data the executive team already reviews. Embark’s analytics and integration team builds the connection.
Frequently asked questions
Can we build our own reports?
Yes. The Power BI model is open to your analysts, and the API exposes the same entities for any tool.
How current is the data?
Field capture appears on sync; telemetry on its polling interval; production data on the import schedule (daily as standard).
Can the customer portal be branded?
Yes. Vendor logo, colours and report names are configured per vendor.
See your chemical program in Prodesy
A 30-minute online demo using your injection points, vendors and lab data. You leave knowing where variance and cost are hiding.
Book a demo