Prodesy Pricing: Standard and Pro, Priced Per Treatment Site
One monthly subscription, priced per treatment site (pumps plus batch treatment sites). Rates fall as your program grows, internal users are unlimited on both plans, and every subscription carries a full refund in the first three months. Use the calculator for your number.
Two plans, one rate card
Standard
From $2.50 to $7.50 per treatment site per month
The complete chemical program record: inventory, pump targets and rate tracking, production import and mapping, field service reporting, sample tracking and lab reporting, ordering and delivery tickets, failure analysis and standard Power BI dashboards.
- Internal users: unlimited
- External users (vendors or customers): $50 per user per month
- Production data mapping: done by the client
- Power BI and service reports: standard templates
Pro
From $5 to $15 per treatment site per month
Everything in Standard plus the automation that makes Prodesy a control centre: scheduling and notifications, daily telemetry integration for tank inventory, weekly or daily production data integration, and direct server access for custom reporting on your own BI platform.
- Internal and external users: unlimited
- Production data mapping and importing: included
- Power BI and service reports: custom
- Server access for your own BI and API integration
Rate card by treatment sites
The per-site rate is set by your total treatment-site count and applies to every site in the program. A treatment site is any chemical pump or batch treatment location with its own target; sites are mapped to production wells inside Prodesy. Programs over 25,000 sites are negotiated.
| Treatment sites | Standard, per site/month | Pro, per site/month | Standard at tier maximum | Pro at tier maximum |
|---|---|---|---|---|
| 1–250 sites | $7.50 | $15 | $1,875 | $3,750 |
| 251–1,000 sites | $5 | $10 | $5,000 | $10,000 |
| 1,001–10,000 sites | $3.50 | $7 | $35,000 | $70,000 |
| 10,001–25,000 sites | $2.50 | $5 | $62,500 | $125,000 |
| Over 25,000 sites | Negotiated enterprise rate. Contact us. | |||
Prodesy monthly cost calculator
Enter your treatment sites (pumps plus batch treatment sites). The rate for your tier applies to every site.
Standard external users are $50 per user per month; unlimited on Pro.
What is included in each plan
| Feature | Standard | Pro |
|---|---|---|
| Inventory management | Included | Included |
| Production importing and mapping | Included | Included |
| Pump target and rate tracking | Included | Included |
| Field service reporting | Included | Included |
| Power BI dashboard reporting | Included | Included |
| Sample tracking and lab reporting | Included | Included |
| Ordering and delivery tickets | Included | Included |
| Failure analysis reporting | Included | Included |
| Scheduling and notifications | — | Included |
| Telemetry integration (daily inventory) | — | Included |
| Production data integration (weekly or daily) | — | Included |
| Server access for custom reporting | — | Included |
Users
| User licences | Standard | Pro |
|---|---|---|
| Internal users (your staff) | Unlimited | Unlimited |
| External users (vendor or customer logins) | $50 per user per month | Unlimited |
Services
| Service | Standard | Pro |
|---|---|---|
| Production data mapping and importing | Client-managed | Included |
| Power BI reporting | Standard dashboards | Custom dashboards |
| Service reports | Standard | Custom |
Additional services (either plan)
| Service | Rate |
|---|---|
| Data administration | $50 per hour |
| Custom Power BI dashboards | $150 per hour |
| Data importing and transformation | $225 per hour |
What Prodesy does that a spreadsheet cannot
Scheduling and notifications
Events, samples and analysis, batch programs. Is monitoring on track? Prodesy tells you before the month ends, not after.
Trend analysis
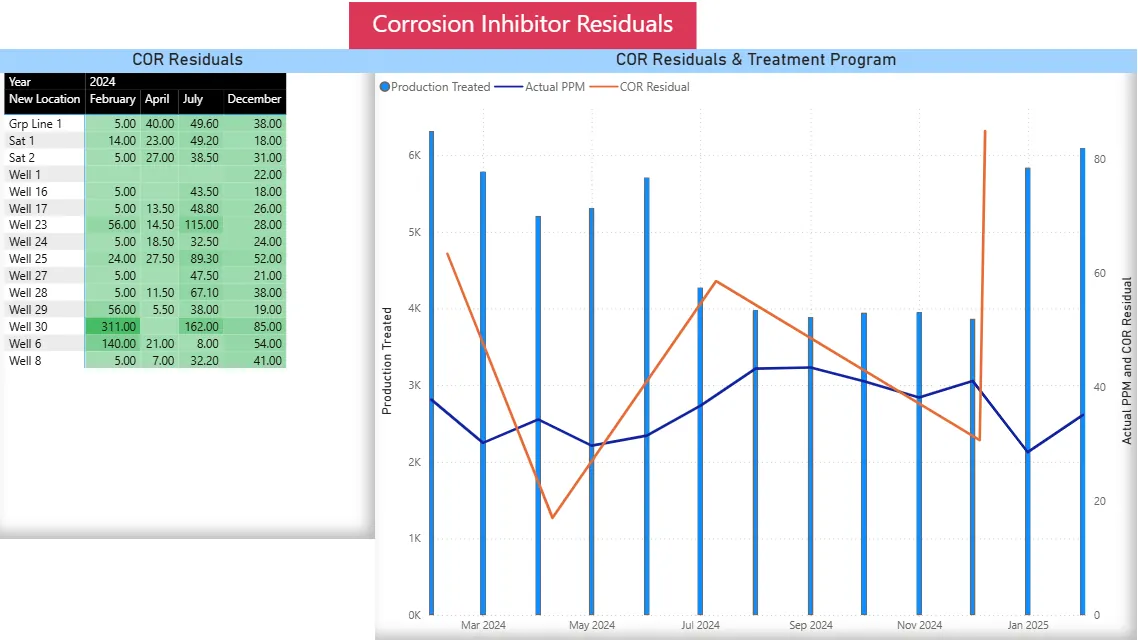
PPM, compliance and objective cost ratios. Are programs economical? KPIs tied to the treatment program show whether the chemical is working.
Comprehensive program analysis
The total chemical program across multiple vendors, with vendor comparisons on the same production data.
Production data mapping
Treatment sites mapped to production wells with a simple import, so actual PPM is tracked and trended against real volumes.
Telemetry integration
Pump controllers and tank levels from any vendor’s devices. Real-time program optimization on the hardware already in the field.
Your own BI platform
Already run Power BI, Spotfire or Looker? Pro plugs your BI directly into the Prodesy database, and an API is available for system integration.
How the subscription pays for itself
The return depends on how much chemical the program buys, which varies by basin. The worked examples below use the same 500-site program in two markets and a conservative recovery of 7.5% of chemical spend: half of the 15% treatment variance that is typical before measurement, counting only over-treatment removed and nothing for avoided dewax, corrosion or H2S events. Deployed Prodesy programs have recorded 8–15% savings (how it works).
| Worked example (500 treatment sites) | High-producing area, Pro plan | Mature, stable area, Standard plan |
|---|---|---|
| Average chemical spend per site per month | $500 | $150 |
| Total chemical spend per month | 500 × $500 = $250,000 | 500 × $150 = $75,000 |
| Over-treatment recovered (7.5% of spend) | $250,000 × 0.075 = $18,750 | $75,000 × 0.075 = $5,625 |
| Prodesy subscription (≤1,000-site tier) | 500 × $10 = $5,000 | 500 × $5 = $2,500 |
| Net monthly benefit | $18,750 − $5,000 = $13,750 | $5,625 − $2,500 = $3,125 |
| Recovered spend per $1 of subscription | $18,750 ÷ $5,000 = $3.75 | $5,625 ÷ $2,500 = $2.25 |
Break-even at 7.5% recovery is chemical spend of $133 per site per month on Pro ($10 ÷ 0.075) and $67 per site per month on Standard ($5 ÷ 0.075) in the ≤1,000-site tier; larger programs break even lower because the per-site rate falls. That is the plan logic: high-producing areas with heavy chemical spend justify Pro’s automation and custom reporting; mature, stable areas are usually best served by Standard. Enter your own spend in the calculator above to see the figure for your program. The Canadian producer case study eliminated $660,000 a month in cost variance; Pine Island doubled lab reporting productivity on the same head count.
Frequently asked questions
What counts as a treatment site?
Any chemical pump (continuous injection) or batch treatment location with its own target. Treatment sites are mapped to production wells inside Prodesy. A well with two products at one location is one site per product.
Which plan do we need?
Standard if your team is comfortable importing production data and working from standard dashboards and reports. Pro if you want telemetry and production data flowing in automatically, scheduling and notifications, unlimited external users and custom reporting on your own BI platform. Most multi-vendor producer programs and vendor programs with customer portals run on Pro.
How are external users charged?
On Standard, each vendor or customer login is $50 per user per month. On Pro, external users are unlimited and included.
Do rates change as we add sites?
Yes. The per-site rate is set by your total treatment-site count, so the rate drops as the program grows. Over 25,000 sites is a negotiated enterprise rate.
Can we use our own business intelligence platform?
Yes, on Pro. Server access lets you connect Power BI, Spotfire, Looker Studio or another BI tool directly to your Prodesy database, and an API is available for system integration.
What if it doesn't work for us?
Full refund at any point in the first three months. After that, cancel on 30 days’ notice.
See your chemical program in Prodesy
A 30-minute online demo using your injection points, vendors and lab data. You leave knowing where variance and cost are hiding.
Book a demo