Treatment Accuracy, PPM Tracking and Real-Time Compliance Alerts
Treatment accuracy is the core metric of a chemical program and the one nobody reports: actual PPM against target PPM, per injection point, per day. Prodesy calculates it continuously and alerts when it drifts.
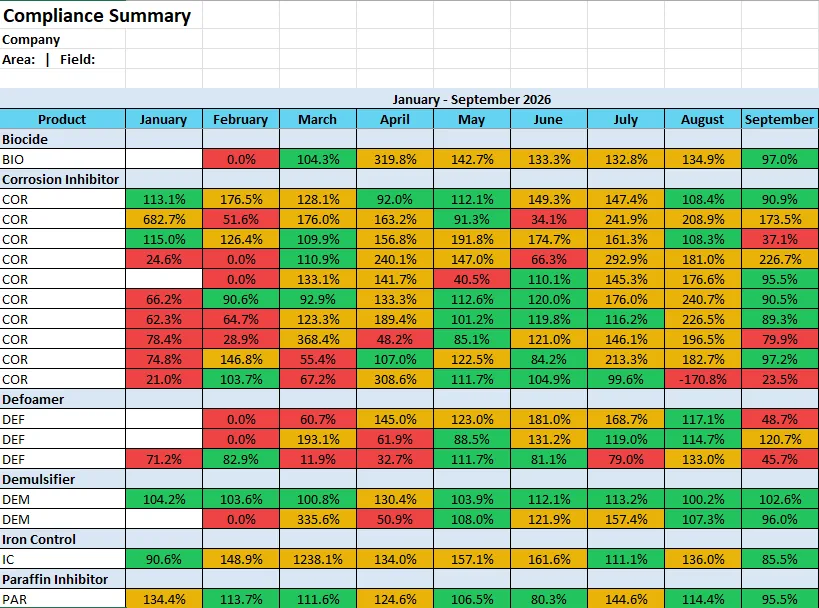
How Prodesy calculates compliance
Target rate per injection point is set in PPM or volume per day. Actual rate comes from pump reads, tank-level change or telemetry. Production volume for the point comes from allocated production data. Compliance is actual over target, per point, per day, rolled up by product, vendor and program. Anything outside tolerance is flagged; anything persistently outside tolerance is escalated.
Over-treatment and under-treatment
Over-treatment is money: chemical invoiced that the well did not need. Under-treatment is risk: the dewax event, corrosion failure or bacteria excursion that shows up as a workover. A program running at 15–20% variance is doing both at once. Programs on Prodesy typically get under 5%; the Canadian producer cut PPM variance from 300+ to 29. The treatment variance guide explains the measurement.
Alerts and escalation
- Per-point tolerance bands with daily evaluation
- Alerts by email, mobile push or dashboard flag
- Escalation to the vendor, the producer or both
- Scheduled follow-up (site visit, sample, batch) created from the alert
- Audit trail of every excursion and response
Use the PPM calculator to convert targets to rates for your fluids.
Frequently asked questions
What tolerance do programs use?
Commonly ±10% per point with tighter bands on integrity-critical wells; it is configurable per point and product.
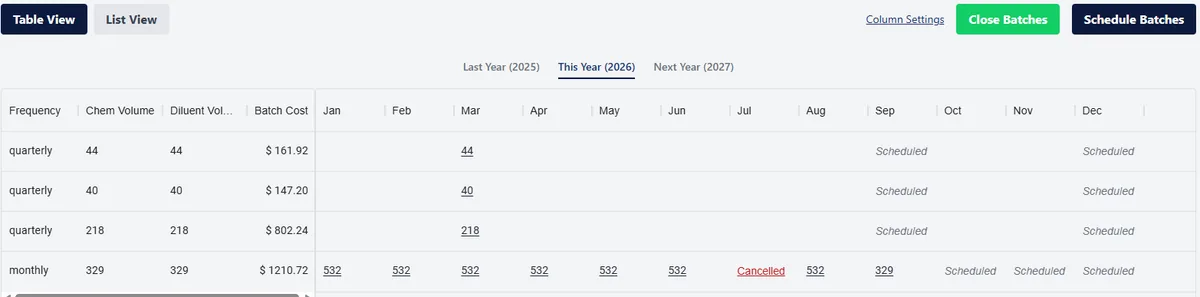
Does compliance work for batch treatments?
Yes. Batches are evaluated against scheduled volume and frequency rather than daily rate.
Can vendors see their own compliance?
Yes, and it is the most effective adoption tool: vendors fix drift before the producer sees it.
See your chemical program in Prodesy
A 30-minute online demo using your injection points, vendors and lab data. You leave knowing where variance and cost are hiding.
Book a demo