Integrated Lab Analysis Workflow and Automated Reporting
Lab results are the proof that a chemical program works. Prodesy tracks every sample from the field to the bench to the report, and attaches the result to the treatment that produced it.
Analyses tracked
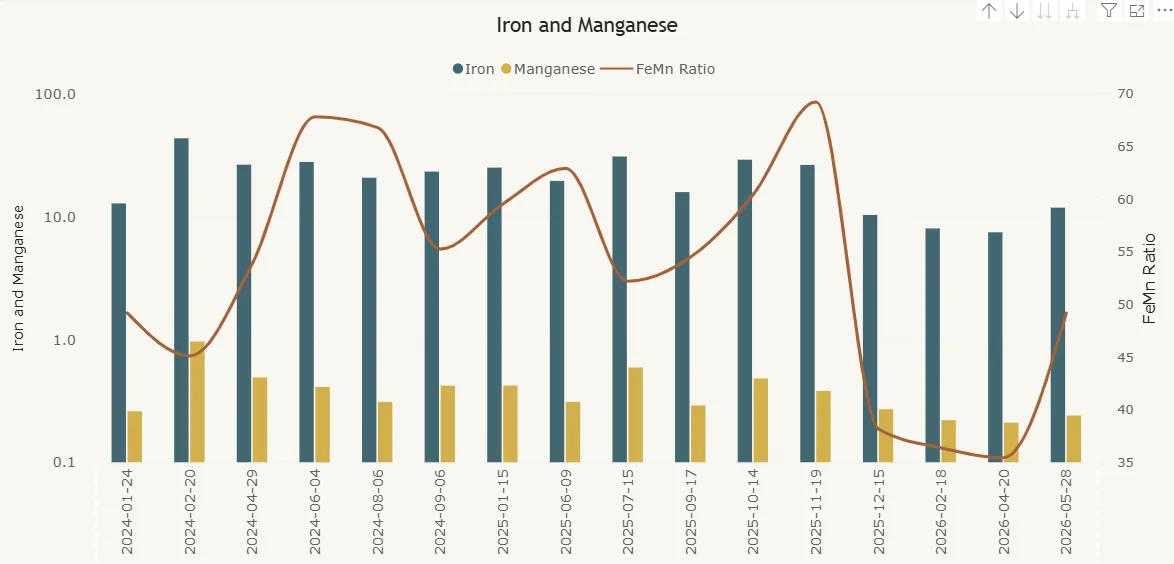
- Water analysis: iron, manganese, suspended solids, pH, chlorides, for scale and corrosion programs.
- Bacteria: ATP, SRB and APB serial dilutions, for biocide programs.
- Corrosion: coupon weight loss, pitting rate, probe data.
- Residuals: corrosion and scale inhibitor residuals per well.
- H2S: inlet and outlet tube values for scavenger programs.
- BS&W and bottle tests for demulsifier programs.
Sample to report
A sample is logged on Prodesy Mobile with site, time and sampler. The lab sees it in the queue, enters results against the sample ID, and the report is generated automatically with the well’s treatment history alongside. Customers receive it in the portal, not as a PDF that has to be found later. Pine Island Chemical Solutions doubled lab reporting productivity on this workflow.
Results as program KPIs
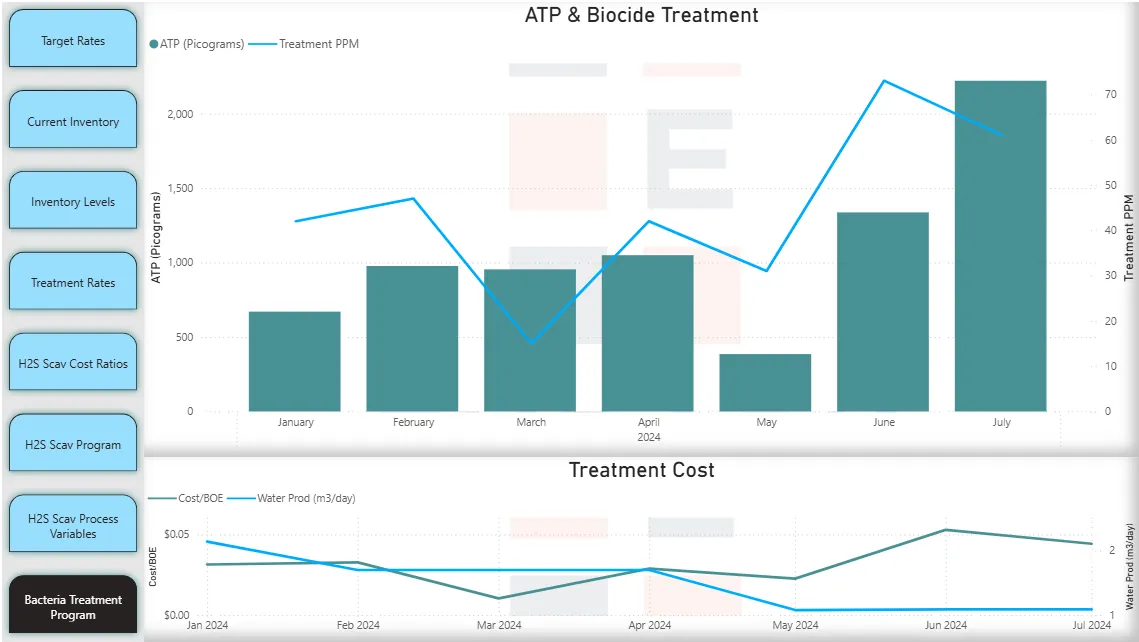
Because every result is attached to a well and a date, Prodesy trends it against treatment. Rising ATP against falling biocide PPM, or a residual that drops while injection stays on target, are visible on the program dashboard and can trigger an alert. Lab data stops being a compliance file and becomes the feedback loop that adjusts the program.
Frequently asked questions
Do we need our own lab?
No. Third-party lab results are imported against the sample ID; internal labs use the bench-entry screens.
Can results trigger actions?
Yes. Threshold rules per analysis type create alerts and can schedule a follow-up batch or sample in the scheduling module.
Is chain of custody recorded?
Yes. Sampler, time, location, receipt and analyst are logged for every sample.
See your chemical program in Prodesy
A 30-minute online demo using your injection points, vendors and lab data. You leave knowing where variance and cost are hiding.
Book a demo