Biocide Program Management with Integrated Bacteria Analysis
Biocide programs fail quietly: batch frequency drifts, the bacteria count climbs, and the first symptom is a microbially influenced corrosion failure. Prodesy trends ATP, SRB and APB results against biocide treatment and water production so the program is adjusted before that.
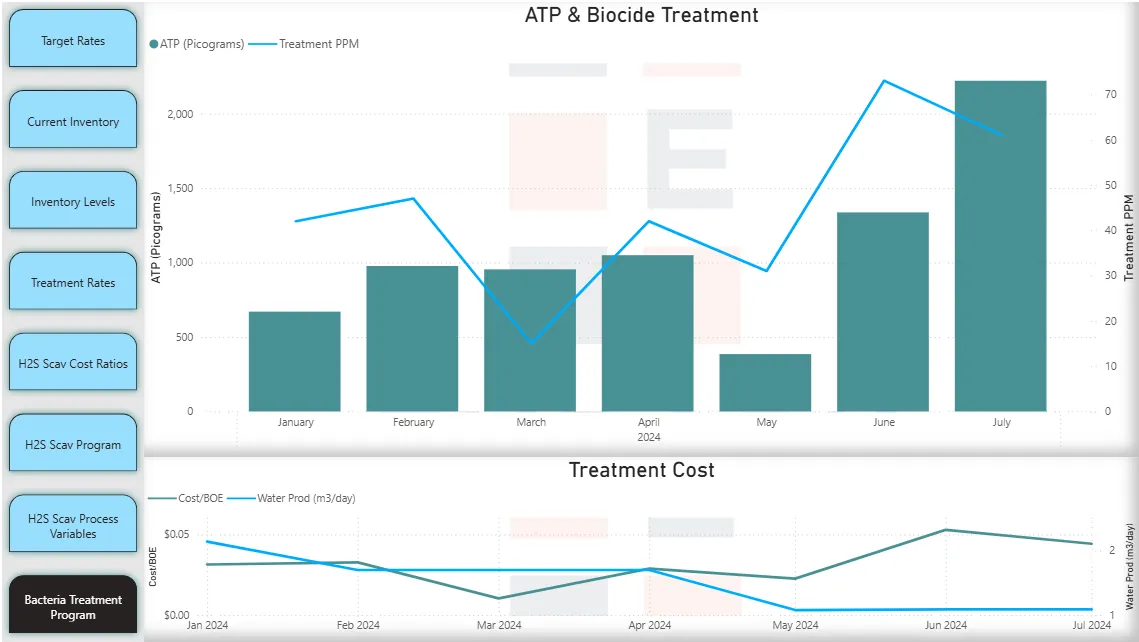
Bacteria data in treatment context
A bacteria result on its own is a number in a lab report. The same result plotted against the biocide PPM and the water rate of the week it was taken is a program decision. Prodesy’s lab workflow logs the sample in the field, records the ATP or serial-dilution result at the bench, and charts it against treatment automatically.
What Prodesy tracks
- Batch biocide treatments vs schedule, with volume and product
- Continuous biocide injection vs target where used
- ATP, SRB and APB results per location and date
- Water production per treated point
- Treatment cost per BOE for the biocide program
- Sampling rounds scheduled and tracked in the scheduling module
Settling the batch-frequency argument
Vendors want more frequent batches; producers want fewer. Prodesy shows what happened to the bacteria count at each frequency the system has actually run, per location. That ends the argument and usually lands somewhere both sides can defend. Pair it with the corrosion program to see MIC risk and inhibitor residuals together.
Frequently asked questions
Does Prodesy support serial dilution as well as ATP?
Yes. Both are logged against the sample with incubation and read dates.
Can sampling be scheduled automatically?
Yes. Recurring sampling events are created per location and tracked to completion with notifications.
Can producers see vendor biocide results?
Yes. Results flow to the producer’s program view when both parties are on Prodesy, or through the vendor’s client portal.
See your chemical program in Prodesy
A 30-minute online demo using your injection points, vendors and lab data. You leave knowing where variance and cost are hiding.
Book a demo