Chemical Treatment Variance: What It Is, How to Measure It, How to Reduce It
Treatment variance is the gap between the chemical a well was supposed to receive and the chemical it actually received. Most programs run at 15–20% and do not know it. This guide covers the measurement and the five causes.
Definition
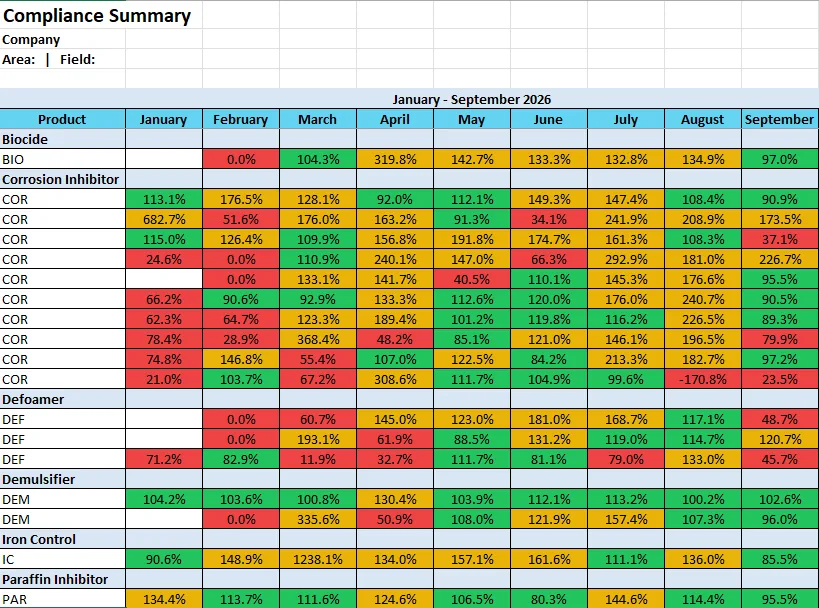
For a single injection point on a single day: variance = (actual PPM − target PPM) ÷ target PPM. Positive is over-treatment, negative is under-treatment. Program-level variance is the average of the absolute values, weighted by chemical spend, so that over- and under-treatment do not cancel out. A program that is 20% over on half its wells and 20% under on the other half has 20% variance, not zero.
Why 15–20% is normal
- Stale production. Rates set on last quarter’s volume; the well has declined 8% since.
- Pump drift. Diaphragm pumps wander; nobody re-strokes until the next visit.
- Infrequent reads. A monthly tank read gives a monthly average; the excursions inside it are invisible.
- Targets never revisited. The number set at start-up is still the number.
- Self-reporting. The party delivering the chemical reports on delivery, not on accuracy.
How to measure it
You need three numbers per point per period: target PPM, actual chemical volume (pump rate or tank-level change), and fluid volume treated. Get the third one right first; it is where most measurement fails. Then calculate per point, then roll up by product, vendor and program. Anything beyond a few dozen points needs software: this is exactly what Prodesy’s treatment accuracy module does with allocated production. Use the PPM calculator for the arithmetic.
How programs get under 5%
- Daily actuals from telemetry where it exists and frequent mobile reads where it does not
- Production allocated to each point automatically
- Tolerance alerts with an owner and a response time
- Vendors seeing their own compliance before the producer does
- Quarterly target review against outcome KPIs
The Canadian producer went from 300+ PPM variance to 29; a paraffin program went from 18% to under 5%; a vendor cut net variance by over 90%.
Frequently asked questions
Is some variance acceptable?
Yes. ±10% per point is a common tolerance; integrity-critical wells run tighter. The goal is knowing the number, then narrowing it.
Is over-treatment really a problem if the well is protected?
It is a cost problem: chemical bought that did nothing, often 5–10% of the program budget. It also hides under-treatment elsewhere when only program totals are reviewed.
How quickly can variance be reduced?
Programs typically halve variance within a quarter of getting daily visibility, because most of it is drift that nobody could see.
Find out what your variance is
A demo on your program usually answers the question in 30 minutes.
Book a demo