How Prodesy Works: The Chemical Program Workflow
Prodesy is a digital control centre for chemical program management. Two workflows run inside it: one for producers, turning current data into accurate treatment rates and measurable savings, and one for chemical vendors, turning automatic updates into more productive field teams and better margins. Both close the loop with the same continuous-optimization stage.
Workflow 1: Turn current data into chemical program value
For oil & gas producers. A continuous flow from production and usage data to accurate treatment rates and measurable optimization.
Stage 1 Accurate treatment rates and chemical savings
Treatment outcomes inform performance analysis ↓ · Program adjustments refine target rates ↑
Stage 2 Measure effectiveness and optimize the program
Ongoing feedback: measure results and continue optimization
What happens at each step
- Three data sources feed Prodesy. Production volumes arrive from accounting or SCADA (production data integration); chemical usage arrives from tank and pump telemetry; field reads from Prodesy Mobile fill the gaps.
- Prodesy combines them into one model per injection site: what was produced, what was injected, what the target was.
- Current target rates are calculated for each site on today’s production, not last quarter’s average (treatment accuracy).
- Vendors and field teams apply the updated targets. The result is typically an 8–15% saving on the production chemical program, from over-treatment removed and under-treatment corrected.
- Stage 2 measures whether it worked. KPI and lab data (residuals, corrosion rates, bacteria counts, H2S, BS&W) from the lab workflow feed performance analysis; treatment rates and chemical selection are refined; changes are verified; and the refined targets flow back to Stage 1.
The Canadian producer case study is this workflow at scale: $660,000 a month in cost variance eliminated once production data was integrated and targets recalculated.
Workflow 2: More productive field teams, more effective programs
For chemical vendors. Automate routine updates, focus field attention and optimize treatment performance.
Stage 1 Save time and manage programs proactively
Field activity and treatment outcomes ↓ · Apply adjustments ↑
Stage 2 Confirm effectiveness and optimize vendor programs
Continuous feedback: confirm results and refine treatment programs
What happens at each step
- Routine updates become automatic. Production volumes and tank levels arrive in Prodesy without a phone call or a site visit, so field time is not spent requesting data or driving to read a tank.
- Proactive visibility shows where attention is required across every customer’s programs, and focused field activity sends techs to the sites that need them before issues escalate. Vendors see up to a 30% increase in field staff productivity.
- The same data drives supply. Current production and inventory forecast product demand; orders are planned around the forecast; inventory, purchasing and deliveries are coordinated on the load board. Better supply chain management means greater product margins.
- Stage 2 confirms effectiveness. KPI and lab data show how each program performs; treatment rates and products are adjusted; improvement is measured after the change; and the outcomes feed back into field priorities.
Pine Island Chemical Solutions and a Western Canadian vendor are both using this workflow in practice.
Both workflows, one control centre
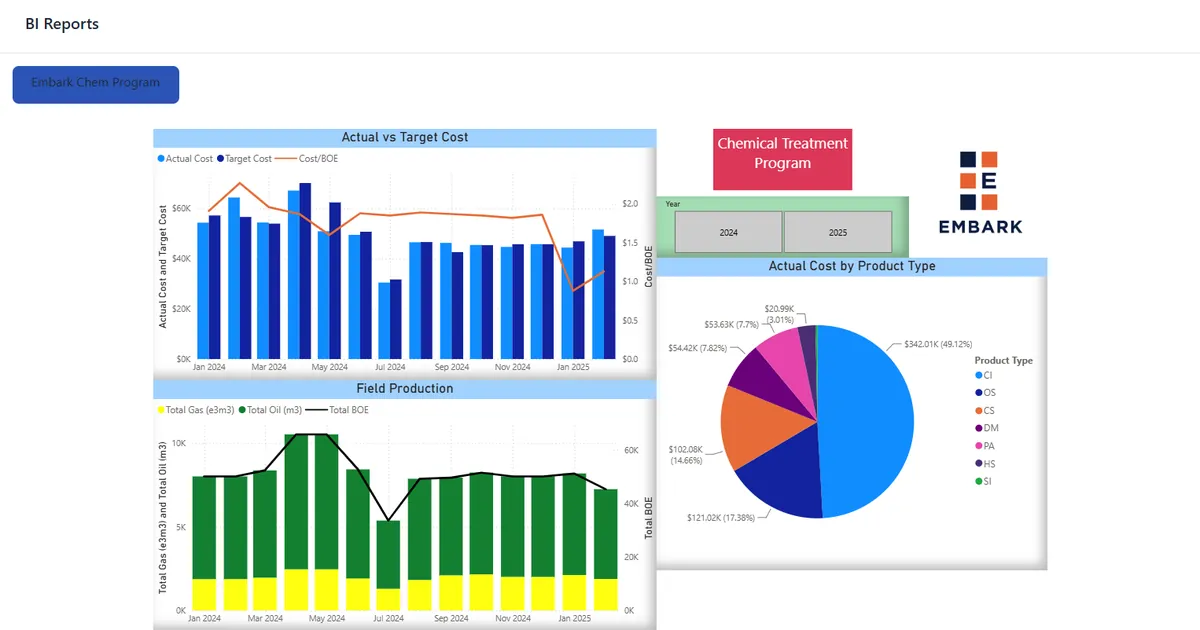
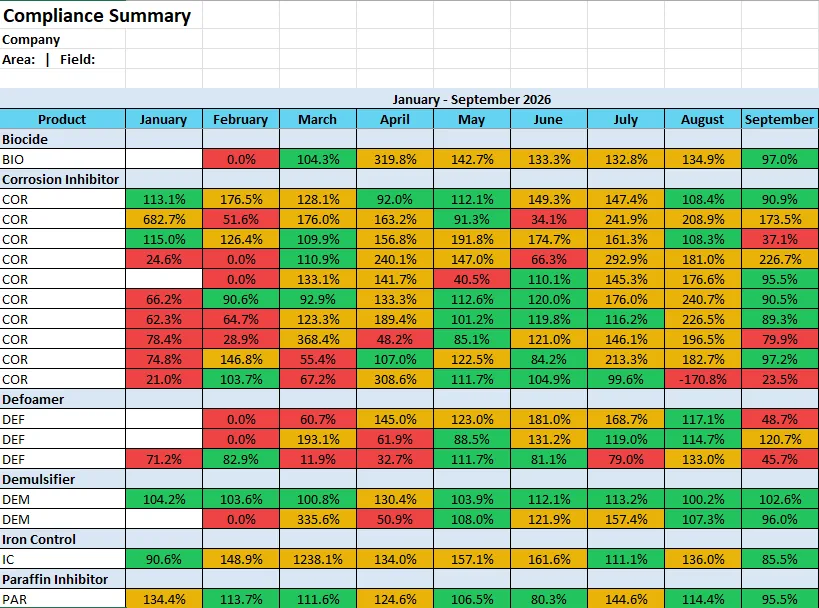
Producers and vendors often run on the same Prodesy instance. The producer sees the independent record of target vs actual across every vendor; the vendor sees the tools to keep it green and the client dashboard that proves it. The feedback loop at the bottom of both diagrams is the same loop: measure, adjust, verify, repeat. That is what makes Prodesy a control centre rather than a reporting tool, and it runs on whatever hardware is already in the field (hardware-agnostic by design).
Frequently asked questions
How long does it take to get to Stage 2?
Stage 1 is live within the 30-day onboarding. Stage 2 analysis is meaningful after the first full month of data and becomes the monthly program review from then on.
Do we need every data source on day one?
No. Production data plus either telemetry or mobile field reads is enough to calculate current target rates. Lab data and additional telemetry are added as available.
Where do the 8–15% and 30% figures come from?
From deployed Prodesy programs: chemical savings on producer programs after target rates were recalculated on current data, and field-staff productivity on vendor programs after routine updates were automated. Individual results are documented in the case studies.
Can a vendor run Workflow 2 for a customer who is not on Prodesy?
Yes. The vendor’s subscription includes a client portal for each customer, so the customer sees results without a subscription of their own.
See your chemical program in Prodesy
A 30-minute online demo using your injection points, vendors and lab data. You leave knowing where variance and cost are hiding.
Book a demo